Columbus Wealth Management Quarterly Update – 2025 Q3
- Columbus Wealth Management

- Oct 6, 2025
- 5 min read
Thank you for following our newsletter! Please be sure you are signed up to receive notifications any time we post by visiting this page (you will see a box at the top to sign up). As always, please don’t hesitate to reach out if you would like to discuss anything in this post!
Firm Updates
CWM Family
On July 3rd, Nick and Kelli welcomed their daughter Piper into this world. Piper and Kelli are doing great, and Max loves being a big brother and holding “little P!”

CWM Office
This spring, CWM moved its office space to Dublin’s Bridge Park! In case you missed our earlier communications on this, our new address is:
6605 Longshore Street
Suite 240 #190
Dublin, OH 43017
We primarily utilize the space to receive mail, and on an as-needed basis for conference rooms. We continue to serve most of our clients virtually, or wherever is most convenient for them.
Client Referrals
As we continue to grow, we have steadily increased our investment minimum for new clients to keep our client count down and service levels high. Our promise has been and always will be responses within 24 hours (usually much less), an advisor who knows your situation inside and out, and a firm that truly cares about you and your goals. As a result, we rely on word of mouth from our existing clients much more than our website these days. We greatly appreciate all of you who have taken the time to leave a review on Google or introduced us to your friends, family, and coworkers. It means the world to us! Our investment minimum for new clients was increased to $1,000,000 earlier this year. If you know someone that you think could benefit from working with us, we would love an opportunity to meet them!
Market Update & Investment Commentary
Data as of 09/30/2025 (unless stated otherwise)
US Markets
Q3 2025 was a remarkable period for U.S. equity markets, with all major indexes posting strong gains. Large growth stocks (Russell 1000 Growth) led the charge, rising 11.68% between July 1 and September 30, followed by small caps (Russell 2000) at 11.24%, the S&P 500 at 8.24%, and large value stocks (Russell 1000 Value) at 4.4%. These gains marked new record highs across the board, with the small caps breaking out of a multi-year rut. Bonds, as measured by the Bloomberg US Aggregate index, returned 2.07% for the quarter.
Investor optimism was fueled by better-than-expected Q2 earnings, continued enthusiasm around artificial intelligence (AI), and growing expectations of Federal Reserve rate cuts. The 'Magnificent 7' tech stocks drove much of the rally, with AI-related investments pushing valuations higher. Despite concerns about market valuations and potential volatility, the broadening of market strength beyond mega-cap stocks was a positive sign. Small-cap stocks and domestic manufacturing sectors showed renewed vigor, indicating a more inclusive bull market.
Below, you’ll find a chart showing year-to-date returns for major US asset classes.

International Markets
International markets also experienced a robust Q3 2025. Developed markets (MSCI EAFE) rose 4.82% for the quarter, while emerging markets surged 10.33%. International Equity performance in 2025 has been driven by higher defense spending, a weakening U.S. Dollar, lower interest rates, and lower than expected effective tariff rates.
Below, you will see a chart comparing the year-to-date returns of international developed (MSCI EAFE) and emerging (MSCI Emerging Markets) market returns.

Economy
The U.S. economy showed perseverance in Q3 2025, with revised Q2 GDP growth at 3.8% - well above the trend rate of 2.1%. Strong consumer spending, rising incomes, and a narrowing trade gap contributed to this performance.
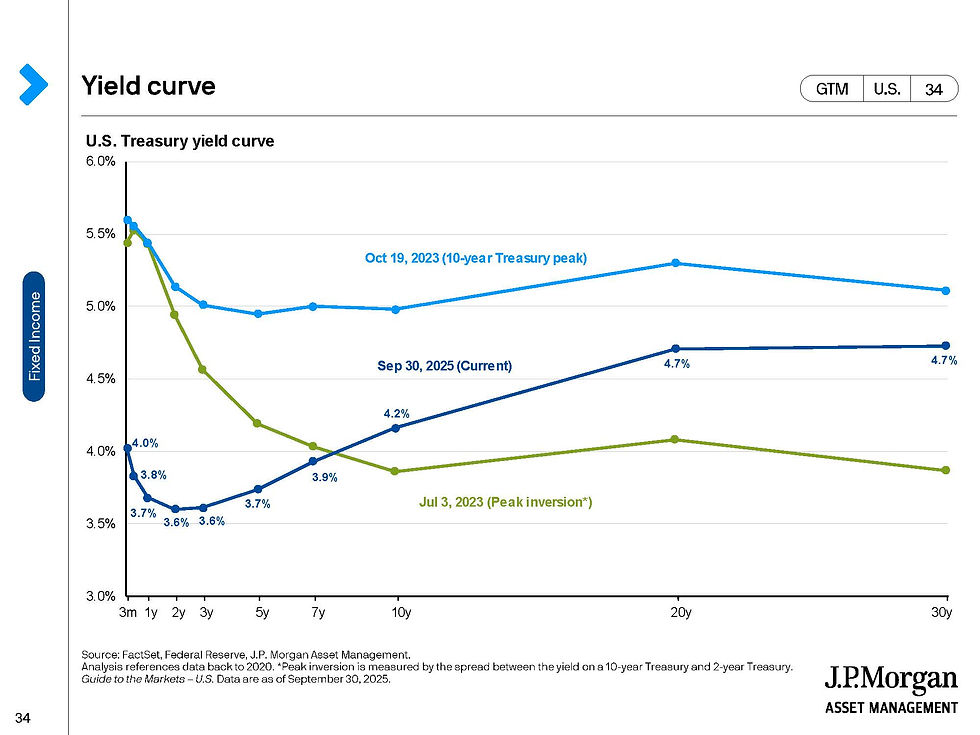
Inflation remained a concern, with the Headline CPI index rising 2.9% year-over-year in August. However, the Federal Reserve delivered a 25 basis-point rate cut in September, signaling a shift toward more accommodative policy. The Federal Funds Rate target is now 4.00% - 4.25%. Below, we’ve included a chart from J.P. Morgan’s Guide to the Markets showing the latest Treasury Yield Curve, compared to earlier timer periods.
The labor market showed signs of cooling, with August non-farm payrolls increasing by just 22,000 and the unemployment rate rising to 4.3% (up from 4.2% in July). Downward revisions to previous months and a decline in foreign-born workers highlighted underlying weaknesses. Toward the end of the quarter, we also experienced another government shutdown, which could also impact employment and consumer spending into the fourth quarter, particularly for government workers who aren’t paid during the shutdown, or who are laid off.
Despite these challenges, retail sales held up in Q3, supported by high-income households and back-to-school shopping. Investment in AI and infrastructure continued to bolster economic activity. Fortunately, there’s also been some relief on mortgage rates which are nearing a 12-month low.
Sources: Bureau of Labor Statistics, Bureau of Economic Analysis, Federal Reserve, Freddie Mac
Summary
Q3 2025 was a period of strong market performance and economic resilience. U.S. and international equities posted impressive gains, driven by AI optimism, earnings growth, and expectations of monetary easing. The U.S. economy maintained solid growth despite labor market softening and inflationary pressures.
Key takeaways for personal investing include the importance of diversification across sectors and geographies, staying invested during volatility, and focusing on long-term fundamentals rather than short-term noise. Investors who remained disciplined and avoided panic during earlier market downturns were rewarded in Q3. As history shows, markets tend to recover and reward patience and strategic allocation. To conclude, the following chart from J.P. Morgan’s Guide to the Markets demonstrates the long-term increase in purchasing power resulting from sustained investment, compared to holding cash, which tends to diminish in value over time.

Important Disclosure Information:
Past performance is no guarantee of future results. Different types of investments involve varying degrees of risk, and there can be no assurance that the future performance of any specific investment, investment strategy, or product (including the investments and/or investment strategies recommended or undertaken by Columbus Wealth Management, [“CWM”]), or any non-investment related content, made reference to directly or indirectly in this commentary will be profitable, equal any corresponding indicated historical performance level(s), be suitable for your portfolio or individual situation, or prove successful. Due to various factors, including changing market conditions and/or applicable laws, the content may no longer be reflective of current opinions or positions. Moreover, you should not assume that any discussion or information contained in this commentary serves as the receipt of, or as a substitute for, personalized investment advice from CWM. CWM is neither a law firm, nor a certified public accounting firm, and no portion of the commentary content should be construed as legal or accounting advice. A copy of our current written disclosure Brochure discussing our advisory services and fees continues to remain available upon request or at www.cbuswm.com. Please Remember: If you are a CWM client, please contact CWM, in writing, if there are any changes in your personal/financial situation or investment objectives for the purpose of reviewing/evaluating/revising our previous recommendations and/or services, or if you would like to impose, add, or to modify any reasonable restrictions to our advisory services. Unless, and until, you notify us, in writing, to the contrary, we shall continue to provide services as we do currently. Please also remember to advise us if you have not been receiving account statements (at least quarterly) from the account custodian.
Historical performance results for investment indices, benchmarks, and/or categories have been provided for general informational/comparison purposes only, and generally do not reflect the deduction of transaction and/or custodial charges, the deduction of an investment management fee, nor the impact of taxes, the incurrence of which would have the effect of decreasing historical performance results. It should not be assumed that your CWM account holdings correspond directly to any comparative indices or categories. Please Also Note: (1) performance results do not reflect the impact of taxes; (2) comparative benchmarks/indices may be more or less volatile than your CWM accounts; and, (3) a description of each comparative benchmark/index is available upon request.


