Columbus Wealth Management Quarterly Update – 2026 Q1
- Columbus Wealth Management

- Apr 3
- 5 min read
Thank you for following our newsletter! Please be sure you are signed up to receive notifications any time we post by visiting this page (you will see a box at the top to sign up). As always, please don’t hesitate to reach out if you would like to discuss anything in this post!
Market Update & Investment Commentary
Data as of 03/31/2026 (unless stated otherwise)

US Markets
Markets have been off to a rocky start in 2026 (particularly in March) with the onset of the conflict in Iran. However, not all asset classes are impacted equally. Small caps, as measured by the S&P 600, are up about 3.5% so far this year, and a portfolio of 60% stocks (S&P 500) and 40% bonds (Bloomberg U.S. Aggregate) is down about 2.6%, which is 1.71% better than the S&P 500 alone (down 4.3%). None of these results are unusual given the scale of the conflict overseas, but they are also well within the range of typical market corrections that can occur for any number of reasons.
Two positives of note in the current market:
AI investment remains a positive contributor to growth and has strong cash flows (rather than just contributing to P/E expansion), in contrast to the dot-com era.
In previous updates, we frequently discussed the “Magnificent 7” stocks: Apple, Amazon, Google, Meta, Microsoft, Nvidia, and Tesla. Until 2026, the focus was mainly on how these stocks significantly outperformed the rest of the S&P 500, while the other 493 companies lagged. We emphasized that diversification is important and advised against concentrating your portfolio in just a few high-performing stocks. This year, as shown in the J.P. Morgan chart below, the Magnificent 7 returned -11%, and the other 493 stocks returned -1%, resulting in an overall index performance of -5%. This demonstrates how valuable a diversified portfolio can be, especially during volatile market conditions.

International Markets & Iran Conflict
International developed equities (MSCI EAFE) are up 1.2% so far this year, and Emerging Markets (MSCI EM) have gained 3.8%. Though we are seeing positive returns here, both have been hurt by the conflict in Iran and have fallen from peak year-to-date returns of 10.2% and 15.7%, respectively. The pullback in international equities (for U.S. investors) has been exacerbated by a modest increase in the dollar versus currencies abroad.
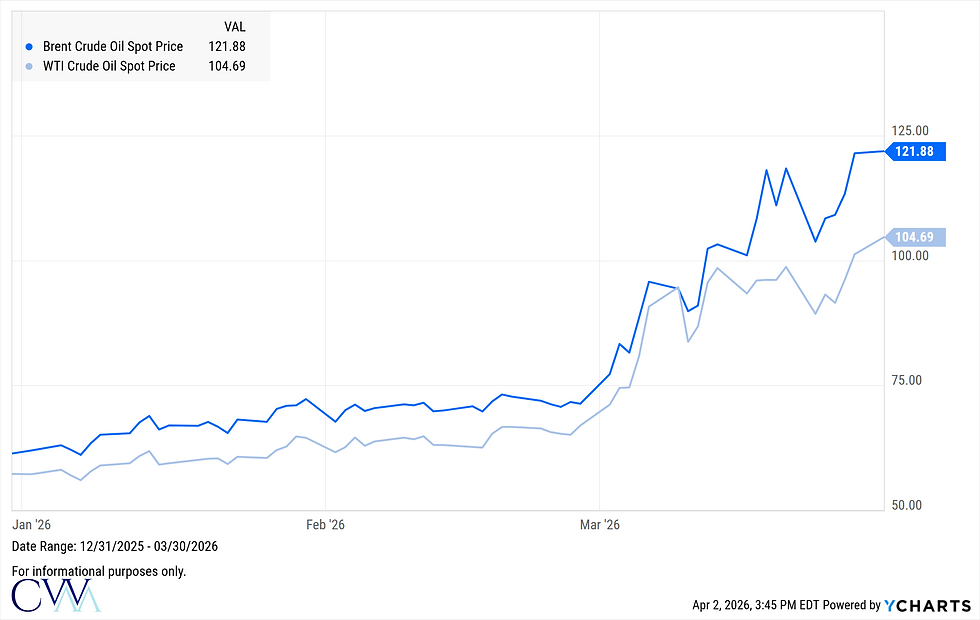
The war has driven up energy prices, primarily because oil tankers cannot safely transit the Strait of Hormuz, affecting global supply. The U.S., now a net oil exporter, is less exposed but still impacted through broader price increases. Oil prices have nearly doubled since the start of the year, as shown in the chart below. While the conflict's end remains uncertain, Iran's leadership and military have suffered substantial damage. With dwindling munitions, approaching elections, market volatility, and rising gas prices, there is mounting pressure to resolve the war quickly.
Economy
As labor-force growth slows—partly due to reduced immigration—the economy increasingly relies on productivity. While AI offers promise, it remains to be seen if its improvements can consistently support growth above 2%. On the demand side, stock market gains have boosted consumer spending, especially among high-income groups. Meanwhile, larger income tax refunds, provided to lower-income households through last year’s OBBB Act, may further stimulate spending.
The chart below illustrates that average import tariffs have dropped significantly compared to initial announcements from a year ago. Following the Supreme Court's recent ruling against certain tariffs, and with concerns that new tariffs could fuel inflation ahead of the midterms, sharp increases to previous tariff levels seem unlikely. This trend should help keep inflation in check and potentially counterbalance rising oil prices.

At the end of March, the average 30-year mortgage rate reached roughly 6.4%, up from just below 6% at the end of February. This uptick has slowed down spring's real estate market. In their March meeting, the Federal Reserve kept rates steady between 3.50% and 3.75%. With year-over-year CPI inflation stabilizing near 2.4% and the unemployment rate holding around 4.4%, the Fed is unlikely to make significant rate cuts soon. However, if inflation drops closer to their 2.0% target or the labor market weakens, the Fed may reconsider its approach.
Sources: Freddie Mac, Federal Reserve, Bureau of Labor Statistics

Summary
The first part of 2026 has served as a valuable reminder that markets do not yield positive returns every quarter. Nonetheless, maintaining an invested position through market fluctuations continues to benefit disciplined investors, as altering asset allocation during periods of volatility may result in missing subsequent recoveries. The final chart illustrates that over the past 36 years, an all-stock portfolio recorded positive one-month returns approximately 66% of the time. In examining rolling five-year periods within this timeframe, about 87% were positive, rising to 93% for ten-year rolling periods. A diversified portfolio consisting of 60% equities and 40% bonds demonstrated even more consistent performance, with positive rolling ten-year returns observed 100% of the time. The key takeaway is that while short-term returns remain unpredictable, diversified portfolios have produced substantially more stable results over longer horizons. It is essential to keep this perspective when constructing and managing investment portfolios and to avoid making significant decisions based on short-term market events. We are available to address any questions or concerns you may have.

Important Disclosure Information:
Past performance is no guarantee of future results. Different types of investments involve varying degrees of risk, and there can be no assurance that the future performance of any specific investment, investment strategy, or product (including the investments and/or investment strategies recommended or undertaken by Columbus Wealth Management, [“CWM”]), or any non-investment related content, made reference to directly or indirectly in this commentary will be profitable, equal any corresponding indicated historical performance level(s), be suitable for your portfolio or individual situation, or prove successful. Due to various factors, including changing market conditions and/or applicable laws, the content may no longer be reflective of current opinions or positions. Moreover, you should not assume that any discussion or information contained in this commentary serves as the receipt of, or as a substitute for, personalized investment advice from CWM. CWM is neither a law firm, nor a certified public accounting firm, and no portion of the commentary content should be construed as legal or accounting advice. A copy of our current written disclosure Brochure discussing our advisory services and fees continues to remain available upon request or at www.cbuswm.com. Please Remember: If you are a CWM client, please contact CWM, in writing, if there are any changes in your personal/financial situation or investment objectives for the purpose of reviewing/evaluating/revising our previous recommendations and/or services, or if you would like to impose, add, or to modify any reasonable restrictions to our advisory services. Unless, and until, you notify us, in writing, to the contrary, we shall continue to provide services as we do currently. Please also remember to advise us if you have not been receiving account statements (at least quarterly) from the account custodian.
Historical performance results for investment indices, benchmarks, and/or categories have been provided for general informational/comparison purposes only, and generally do not reflect the deduction of transaction and/or custodial charges, the deduction of an investment management fee, nor the impact of taxes, the incurrence of which would have the effect of decreasing historical performance results. It should not be assumed that your CWM account holdings correspond directly to any comparative indices or categories. Please Also Note: (1) performance results do not reflect the impact of taxes; (2) comparative benchmarks/indices may be more or less volatile than your CWM accounts; and, (3) a description of each comparative benchmark/index is available upon request.


